KPIs and data-driven work in finance

Data-driven work: Why finance teams need their very own KPIs

The finance department is the heart of every company. Here, financial ratios and liquidity are monitored, and data and KPIs (“Key Performance Indicators”) from across the company are brought together to examine their impact on the company. When it comes to the efficiency of other departments, as well as forecasting, P&L and cash flow, the finance department knows exactly what’s going on. Yet, how does the finance team itself actually measure their work – beyond business and strategy issues?

Data-driven work is commonplace in departments such as sales, customer success and marketing. Clear business goals are matched with KPIs to show progress behind individual measures. Instead of using their own metrics, the finance department likes to work with those of the other departments and thus monitor the development of the company – their own work however remains unmeasurable. Why is that? Experience shows that finance teams tend to do the planning for other departments. It is possible that finance teams, as guardians of “corporate health”, are primarily focused on the overarching business KPIs, while their own operational KPIs are relegated to the background or are not even defined in the first place. Maybe because they have no direct influence on the business to begin with?

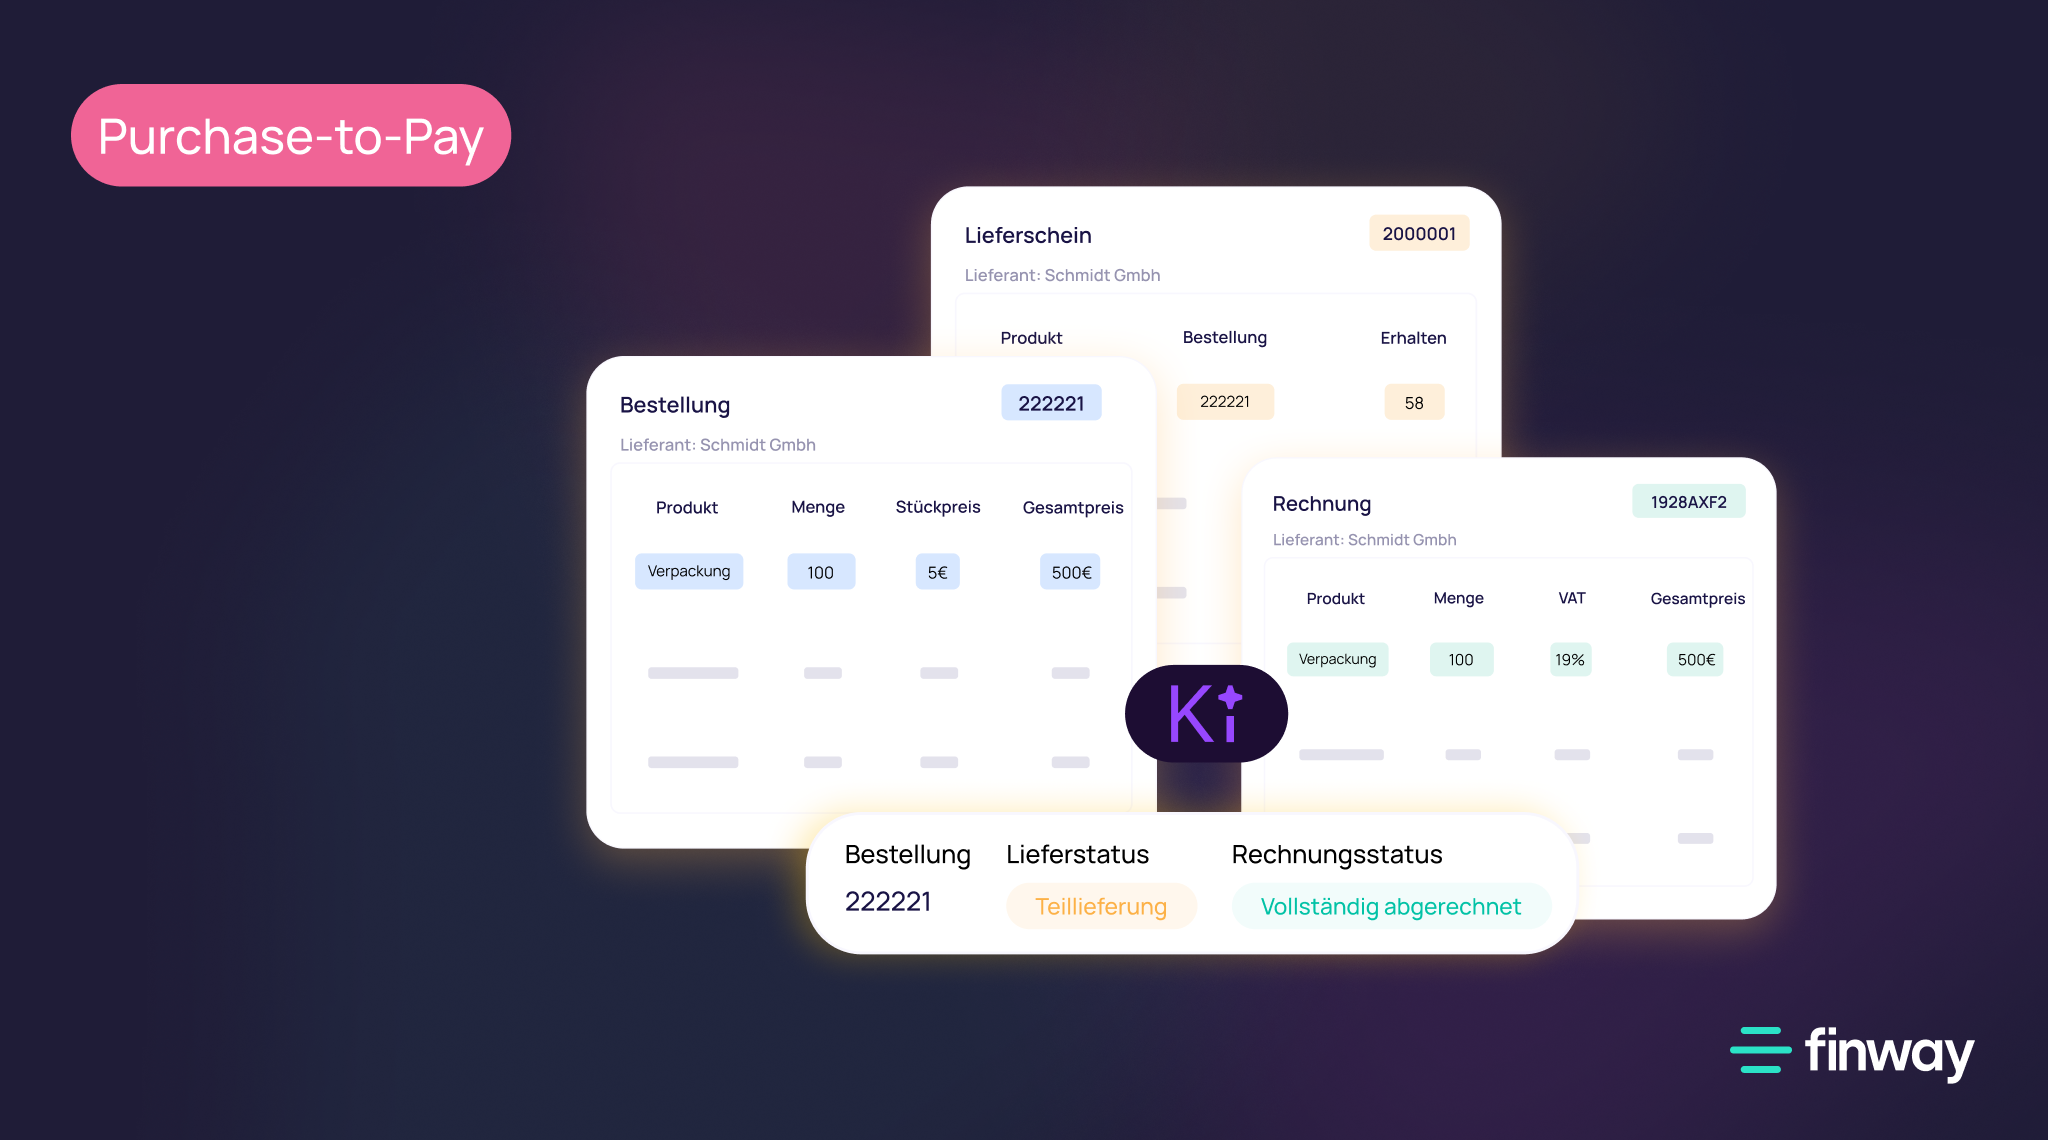
Finance teams therefore rarely judge their own work on the basis of KPIs. Yet there are enough processes and workflows that can also be provided with KPIs and checked for their efficiency – first and foremost the area of accounts payable. In the following, we would like to provide suggestions on how data-driven work in the finance team can succeed.

Why are KPIs so important for individual teams?

Tracking KPIs helps to make visible how a company is developing and whether the individual teams are working in the right direction. Based on this, strategic decisions can be made or discarded. Both within the company and in comparison with the market, these KPIs can help to pin down efficiency, costs or results of the different company processes. However, we have to make a distinction between business and operational KPIs.

Examples of business KPIs:

Customer Churn Rate” and “Customer Acquisition Costs” are common and important indicators for SaaS companies. Also “Monthly Recurring Revenue” (MRR) and “Annual Recurring Revenue” (ARR) are KPIs that are often looked at to assess performance. For manufacturing businesses, on the other hand, production volume is an important metric.

So in the end, the key indicators are very industry-specific – at least when it comes to performance controlling of the entire company.

And for finance teams? Cross-industry metrics are definitely possible. To ensure that the title of this blog post “Data-driven work within finance teams” actually refers to data within finance, here are some suggestions for operational KPIs. After all, the finance organization not only needs to keep an eye on others, but is also welcome to put themselves to the test …

Data-driven work? 5 KPIs finance teams can use to put their processes to the test

They say you should sweep your own house first. After all, there are enough processes in finance to be scrutinized – even if they are relevant in the overall construct of a company, but maybe not as shiny as what marketing and sales do on a daily. That’s why we’re taking on the role of the “bad cop” here and simply asking a direct question:

How well does your finance team actually work?

In order to find an answer to this question and to form KPIs that are actually meaningful, a high level of data quality is required. The next question therefore is: Are there automated processes in your company? Are workflows defined and adhered to? Is there a regular review in which you discuss in detail how the past planning period has been?

You can introduce these KPIs for data-driven work in the accounts payable (AP) finance team: 

  1. Cost per Invoice
  2. Invoice Lead Time
  3. Number of Invoices per FTE
  4. Automatic Distributing Percent
  5. Touchless Processing Ratio

1. Cost per Invoice

With this metric, you’re basically asking the question: How effective can your accounting department be? By determining how much it costs your company to process an invoice, you give one of the most important processes a basis for evaluation. However: For a meaningful KPI, you also need to include the hidden costs – namely, those of processing time and manual work by your employees. In a company that mainly processes invoices manually and (help!) still works with paper and running files, the cost per invoice is likely to be much higher due to those long processes than in a company that already relies on automation and digitization. Human error would also be factored in here.

Other factors for the calculation could be:

  • Tools and equipment
  • Mailings and printing of invoices (for “paper companies”)
  • Invoice errors, invoices paid late, invoices paid twice
  • Wasted savings, e.g. cash discount due to late payment
  • Costs of invoice verification

Once you have established this formula, it is already possible to draw good conclusions about how efficiently your accounting department is functioning (with the involvement of employees in other departments) and how this KPI affects your profitability.

But: Due to the individual factors, this KPI is less suitable for a market comparison than for an internal optimization process. And here, too, the outcome cannot always be read literally, because the introduction of a tool can increase the cost per invoice in the short term – however it should streamline processes in the long term and thus have a positive effect on the KPI again.

According to the “State of ePayables Report” 2021 by Ardent Partners, companies spend the equivalent of 8.40 euros per invoice on average. For companies with low automation processes, the figure is almost 10 euros, while finance teams that rely on a financial operating system spend only 2 euros or less per invoice.

2. Invoice Lead Time

How long is the “lifecycle” of an invoice, from the time it is received to the time it is paid and posted to the financial operating system? The following could be processes that are considered in this KPI:

  • Receipt and, if applicable, digitization and uploading of the invoice
  • Invoice matching with purchase request or contract (e.g. for subscriptions)
  • Assign amount to a cost center if necessary and reconcile budget
  • Check invoice for correctness and invoice approval
  • Final invoice posting and transfer to tax advisors (e.g. via Datev)

If you already use an invoice management tool, you can easily track this process and the individual metrics. The KPI then clearly shows the efficiency in the workflows around vendor invoices.

On average, it takes companies 6 to 7 business days to process an invoice from front to back. The best in class manage this process in a single day – thanks to a high level of automation and thus only a few “personal” touch points with the individual invoice. This, in turn, cuts down on the behind-the-scenes work that causes delays in paper-heavy processes. The finance team, in particular, can focus on value-adding work as a result of the reduction in workload, helping to drive the business forward.

A nice side effect is that the fast processing of invoices allows to take advantage of cash discounts, thus optimizing liquidity.

3. Number of Invoices per Full-time Employee

Another KPI you can apply to the finance team for deeper insights is the number of vendor invoices processed per full-time permanent employee within the accounting department. This metric is not the most obvious at first, but it provides another piece of the puzzle for measuring productivity and efficiency of the finance team. To do this, you can simply divide the invoices generated in a certain cycle (e.g. quarterly or annually) by the number of staffers. The higher the invoice turnover volume, the more effective the underlying processes appear to be.

4. Automatic Distribution Percent

This KPI assumes that your finance team is already working with an automated tool like finway to process invoices. This key indicator shows the percentage of invoices that are automatically assigned to the correct approver without the need for a user to intervene. Rule-based workflows in the tool (triggered by e.g. cost center or retrieved budget) can help with this, supporting automated invoice approval.

With digital invoice approval based on automating workflows, invoices can be approved up to 85 percent faster.

This ensures lean processes and creates more capacity in the finance team for strategic tasks.

5 Touchless Processing Ratio

Similar to the previous KPI, the Touchless Processing Ratio also specifies a percentage of invoices that are processed without employee intervention – but in the entire invoice processing process. This means that the workflow is digital and automated, from receipt of the invoice, through capture, to checking and approval, and final posting in the invoice management tool. This KPI is therefore designed to maximize the efficiency of your finance team.

Other KPIs and metrics for finance teams: 

  • Earnings before interest and taxes (EBIT) = operating profit in a given period
  • Economic value added (EVA) = key figure for the period-related operating surplus
  • Contribution margin = difference between revenues and variable costs
  • Liquidity ratio = ability to extinguish or retire current liabilities with cash or quick assets
  • Interest cover = ratio of debtor’s interest expenses to revenues
  • Days in accounts receivables = Days until AR invoices are settled
  • Net cash flow = cash flow after deduction of expenses relevant to expenditure from gross cash flow
  • Gross profit margin = (Sales – cost of goods sold)/sales
  • Transactions error rate in the processing of invoices

Automation & data-driven working in finance teams

Let’s summarize: When it comes to measuring finance team efficiency, you need a good data foundation for these operational KPIs. A finance operating system like finway can help to view this data on a daily basis. But such a tool not only streamlines accounting processes through automation, saving bare days of work – it also creates transparency and real-time insights, which in turn can be used to derive strategic learnings and new business KPIs to keep the company growing.

Take liquidity management, for example: if you know your cash flow on a daily basis and can take a look into the future thanks to the scenario manager, you can also make forecasts more accurately. This enables you to make more relevant statements about your working capital and thus create new business metrics. In a financial operating system, strategic and business KPIs flow together, allowing the finance team to work on several levels in a data-driven manner.

Rechnungsverbeitung mit finway

Want to save your accounting team some time?

Get a demo